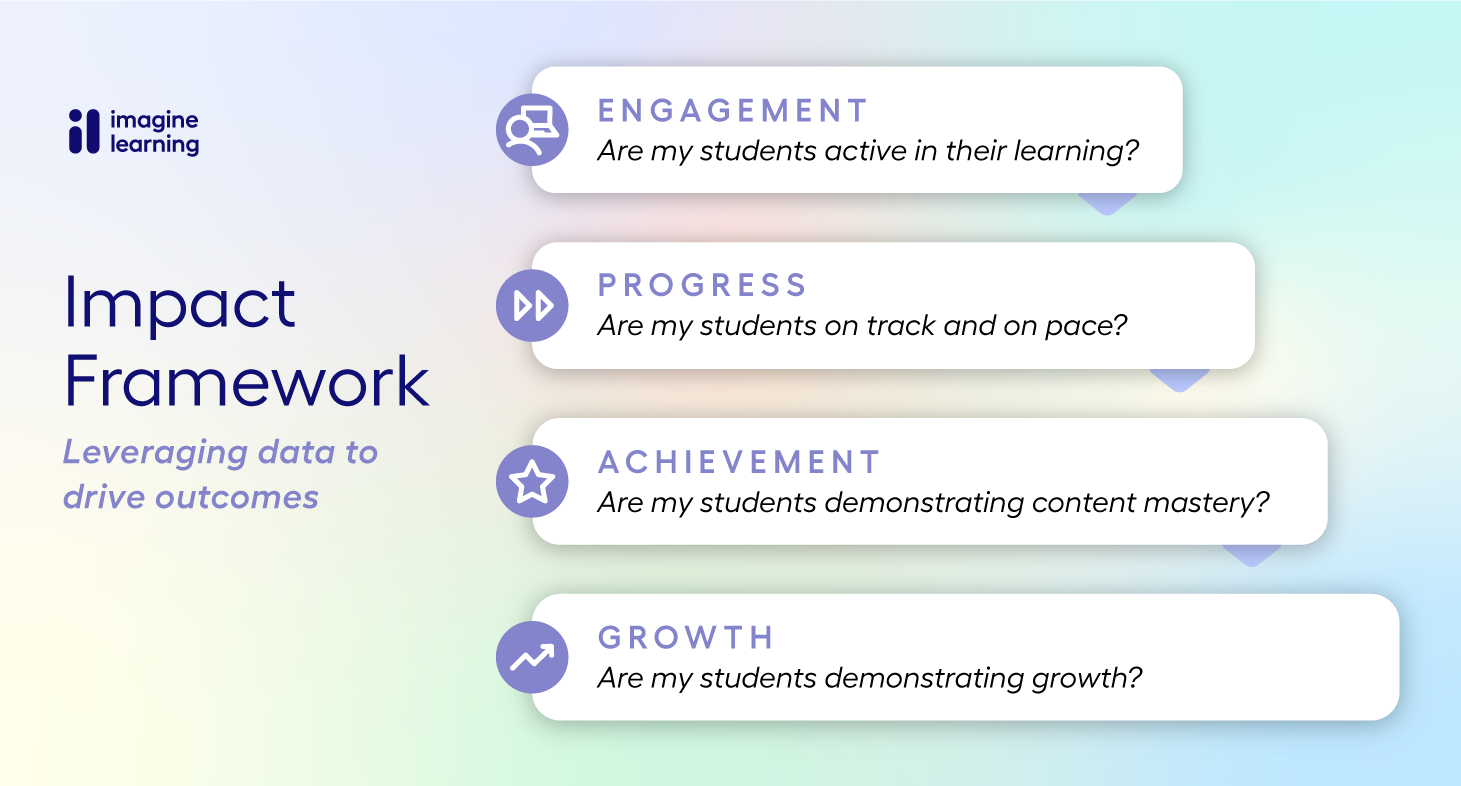
There are as many ways to make an impact in education as there are students in school. By ‘zooming out’ from only measuring impact the traditional ways – retention, test scores, graduation rates – educators can explore how comprehensive their impact is and could be.
Some days, seeing a student show empathy toward another classmate is evidence of a well-implemented social and emotional learning program. On other days, you can hear the impact of comprehension lessons as you listen to a small group literature discussion. A school’s growth can look like: more languages being heard on campus, math and science bowl awards in the trophy case, connecting courses to career paths, and the student-led pursuit of ‘what’s next.’
The success of a school or district’s impact is often all in how it’s measured.
How can we help?
More educators – from the classroom teacher to the superintendent – are adding metrics like student agency and engagement to how they track positive impact. With that in mind, Imagine Learning set out to determine how we could help chart success as we work closely with them.
Elizabeth Lehnertz, Vice President of Marketing, explains: “We really want to work in partnership with our customers to set a growth trajectory. Growth is the ultimate outcome for our products, but the road to get there isn’t something that happens overnight. That’s why we’ve been thinking about the metrics that lead up to growth.”
After discussion and consideration, the Imagine Learning team identified the metrics of its Impact Framework, as well as questions to consider and examples at each step:
- Engagement
- Progress
- Achievement
- Growth
Each metric builds on the one before it, so setting goals according to each one provides a strategic road map to growth. Lehnertz states, “The use of these performative metrics can vary by the [Imagine Learning] product you’re using and by the year of implementation, which is why we’re interested in working collaboratively with our customers to set goals that will drive growth.”

